
🎯 State After Reading This Document
- Understood the context about the project and the problem.
- Understood what design process was undertaken to integrate the map and canvas.
- Learned about the difficulties experienced and attempts to solve them during the process of integrating Naver Map and canvas.
- Finally understood how Naver Map and canvas were integrated.
🤔 Background
I'm currently participating and learning in Naver BoostCamp 9th cohort.
Before I knew it, I was doing the final group project, and we decided to proceed with the theme of "Location-based Service."
Within the large category of "Location-based Service," we had to decide on a detailed topic to proceed with.
Rather than business viability or originality of ideas, it was a topic that started with the intent of "Let's solve problems that we would actually use, problems around us."
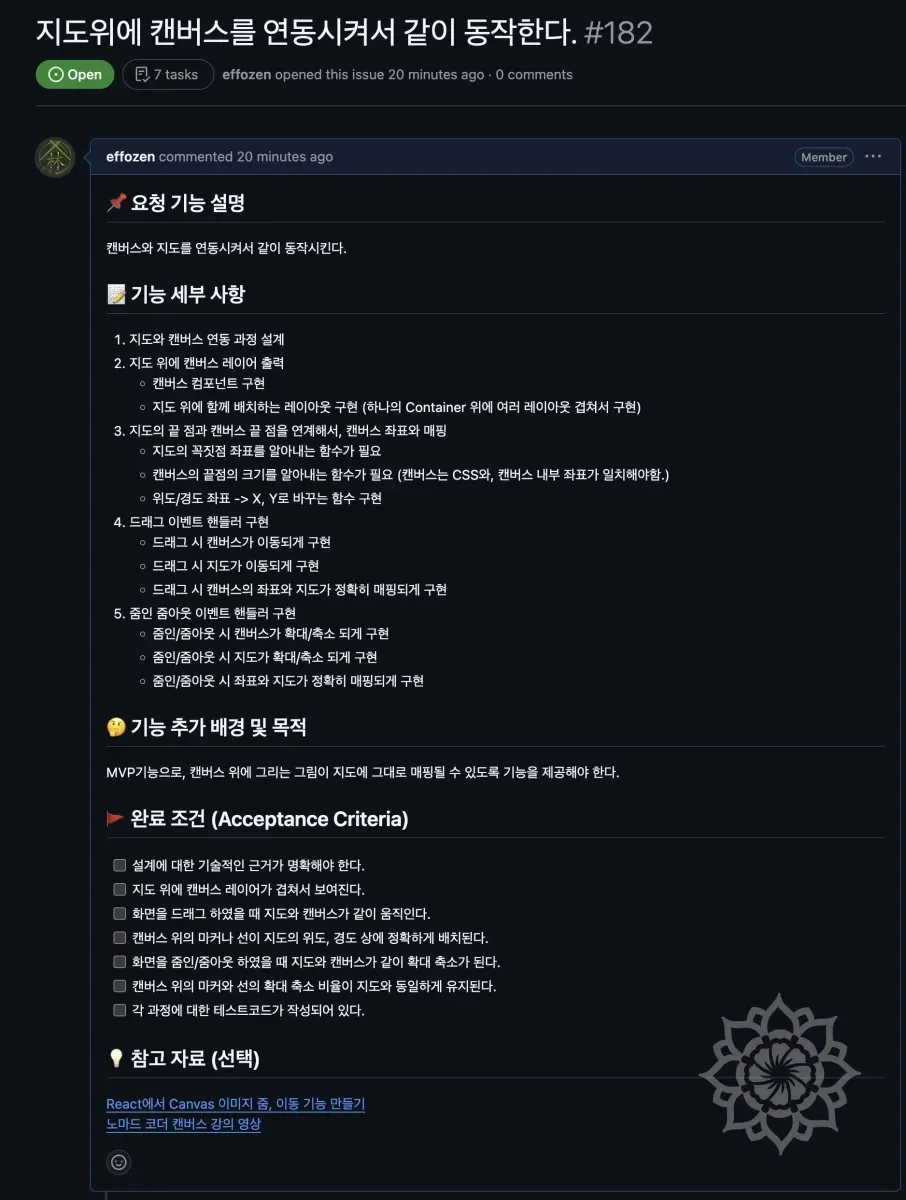
The topic was "Accessibility-based Location Service for Middle-aged and Elderly," and the core is to display a canvas on top of a map, where children can mark routes to deliver to their parents.
Naver BoostCamp 9th Group Project - DDara
To help understand, I'll first leave a GitHub link to our project.
🤔 How to Start?
The task I was assigned in the team was the integration between map and canvas.
Since both Naver Map and canvas were new to me, I had many concerns about how to integrate them.
So the first thing I did was research.
I needed to know what these technologies are and how they work in order to design.
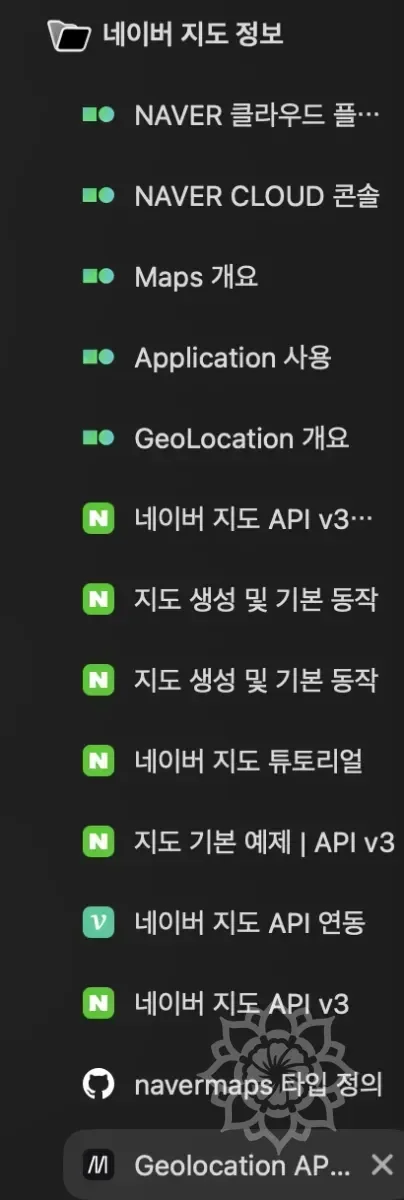
This is part of the materials I found, the remaining materials after organizing once.
I found many materials including all kinds of usage materials from Google search, Naver Map team's QnA, and type GitHub for type-related issues.
In case it might be helpful, I'll leave some reference materials.
Geolocation API Official Documentation
Naver Map Zoom Level Differences
- Regarding zoom levels, Naver Map uses levels 1-21, and levels 1-6 are all treated as the same level. Abstractly, 16 levels is correct, but strictly speaking, it's 21 levels.
🧑💻 Direction Found Together
Based on this research, I had meetings with my colleagues.
We discussed together what perspective to approach from, what features are needed, etc.
Especially, since we decided to treat the map and canvas as different layers, we discussed together what interface to use between layers.
Initially, we thought of the following form.
We were thinking based on this, but a colleague gave me an excellent solution.
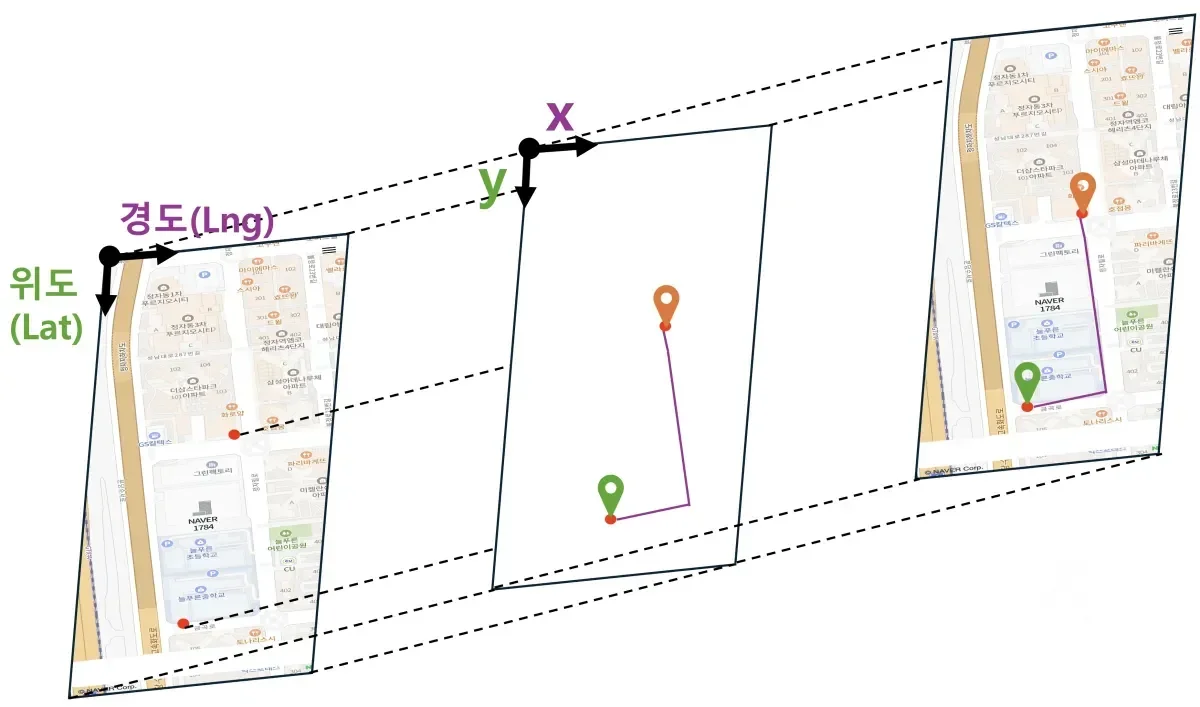
Let's make data with only latitude and longitude.
And this meant that on the canvas, we would convert to coordinates and output.
The background map becomes the reference for the drawings on the canvas, and to connect both, some reference point is needed - the opinion was what about making that latitude and longitude.
At first, I didn't understand well, so I asked many questions and raised doubts during the discussion process.
When trying to express simply in words, there were many parts that we misunderstood each other.
So, we discussed the structure while drawing pictures, and our thoughts were synchronized and we could understand clearly.
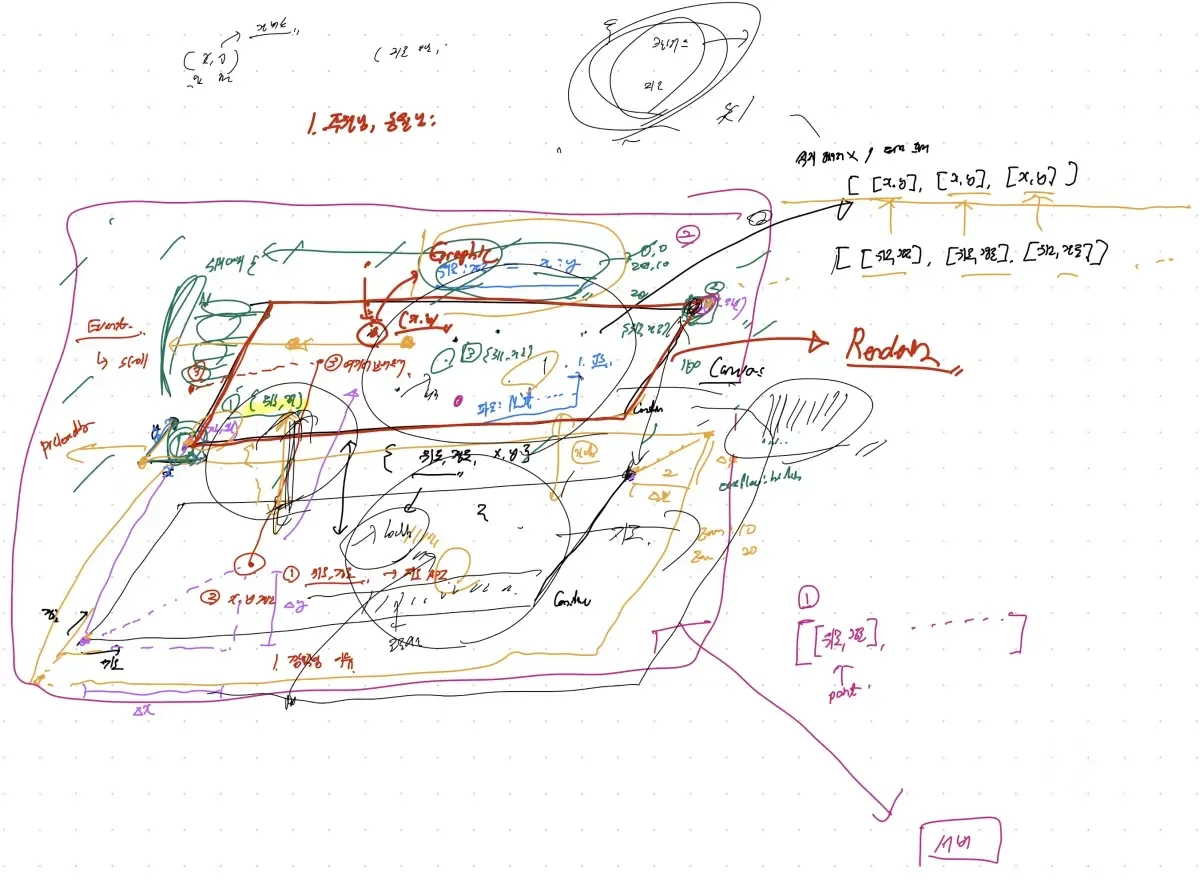
As we visually aligned together like this, beyond simple interfaces, we started to see how to implement.
The content extracted was as follows.
- Let's put the map and canvas as different layers, and create an interface that exchanges latitude and longitude between layers.
- In the canvas, let's receive the map's latitude and longitude and convert to canvas coordinates for output.
- Let's handle only (latitude, longitude) as data.
- During drag events, each should move by the same change amount.
- During zoom in/out, it should zoom at the same ratio.
We discussed together and set the direction like this.
🖼️ Extracting Work Process
With the direction set, we officially started working.
And the first thing I did was to understand what process I need to go through to implement this.
It was a situation where estimates weren't set for what features are needed, how much time is required to solve a specific problem.
So, based on existing development experience, I quickly listed expected tasks and organized the order. And in that process, I wrote down things I thought were necessary.
📝 Establishing a Plan for Design
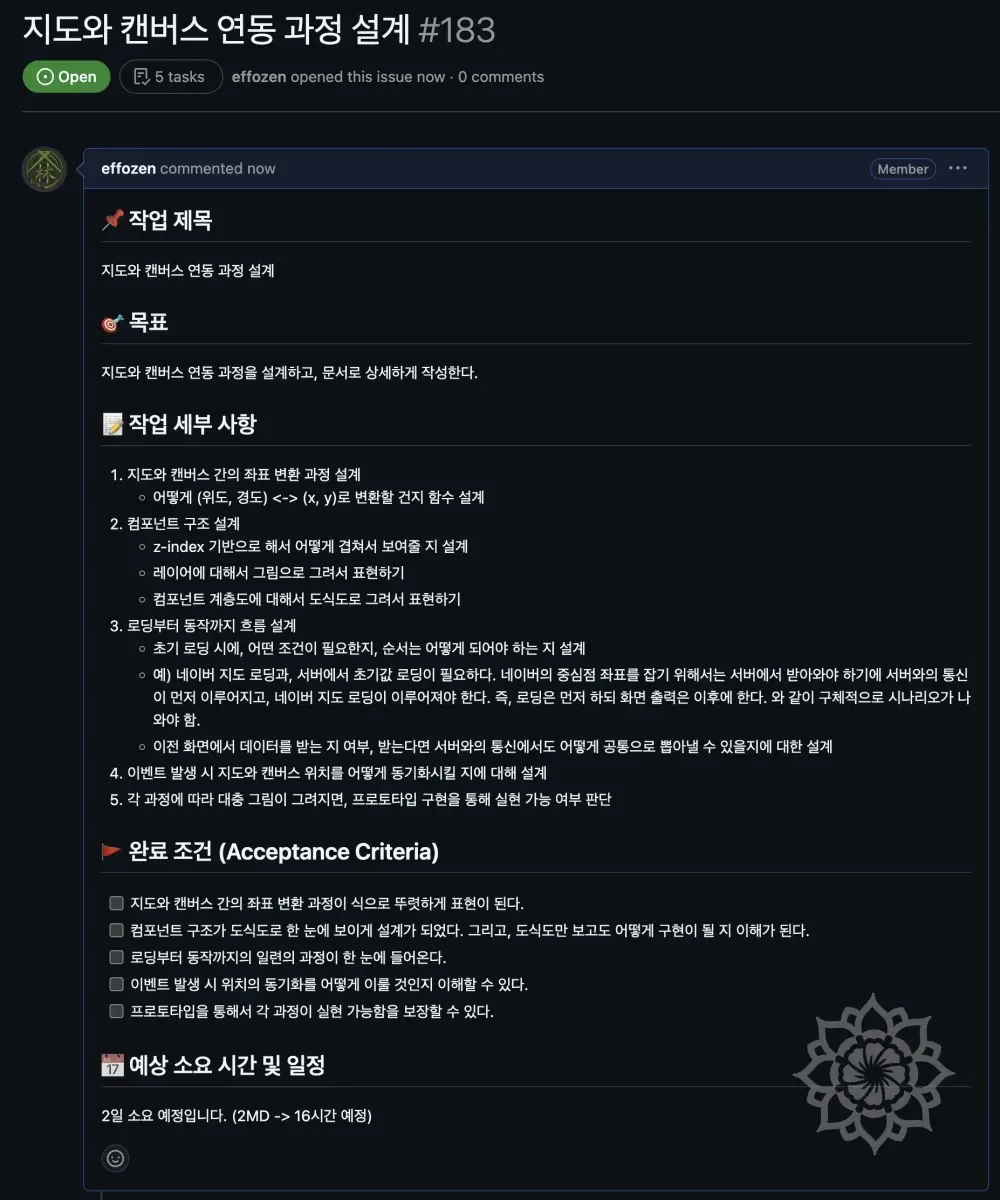
"Let's see the path first before starting development." is a development philosophy and habit I have.
Rather than being perfect, design purely to see the path. Therefore, design needed to be done as simply and quickly as possible.
This too had the risk of taking a lot of time if entering design without drawing a rough picture first.
So I quickly listed what things to consider and determined their order.
📝 Beginning the Full-Scale Design :: Content Analysis
While entering design, the first thing I did was to understand the more detailed structure of the map and canvas within the project itself.
To understand this, I had many conversations with colleagues. We had frequent mutual synchronization sessions about whether what I was thinking was correct, what colleagues were thinking, etc.
By aligning our thoughts about the project with each other, we drew the following picture based on this content.
While creating this, we also proceeded to identify related elements.
Through the above process, we understood the structure of the map and canvas.
For the canvas, I tried to understand by quickly listening to the necessary parts of Nomad Coder's canvas course, and for Naver Map, I referenced examples.
Through this, I was able to quickly understand what data each needed to operate and what was required.
Not only this, but I also examined the Naver API directly to understand how it works, and the content I understood is as follows.
⚙️ Canvas-Related Element Analysis
- Canvas has (0, 0) at the top left, x increases going right, and y increases going down.
- Longitude corresponds to the X coordinate on the canvas.
- Latitude corresponds to the Y coordinate on the canvas.
- The canvas size is fixed, and only the elements drawn inside change.
- Events related to canvas only occur inside the canvas.
- Canvas has basic HTML-related events mapped, but graphics operations must be implemented in JS.
⚙️ Map-Related Element Analysis
- The map uses the Naver Map API.
- The map is based on latitude and longitude.
- Each element is implemented in tile format. (A tile means a part of the map.)
- Unlike canvas, the map has its own events, and when an event occurs, the map's own event handler operates.
- The map is rendered slightly larger than the
HTML tagelement that becomes theWrapper. (Map size means the map's size, and Wrapper means the HTML tag that wraps the map.) - When exceeding the pre-rendered range through drag or zoom in/out events, it re-renders.
As above, the map is composed in tile format, and each tile was created with img tags.
In handling events and other operations, I thought about overwriting the existing events the map has, but operating each image tag individually or considering related processing logic seemed excessive. Also, there was the problem that it didn't match the project's goals.
Accordingly, we solidified the design in the direction of the initial plan to put the map and canvas as separate layers and create an interface that sends and receives latitude and longitude between layers.
📝 Map and Canvas Integration Structure Design
The team's ultimate goal was modularization.
When considering expansion, what our team ultimately aimed for was to make the canvas linked to the map usable in other places as well.
The goal was to release the logic linked to the map and the canvas separately from the map as open source.
To achieve this, we needed to cut the dependency between the map and the rest of the structure as much as possible.
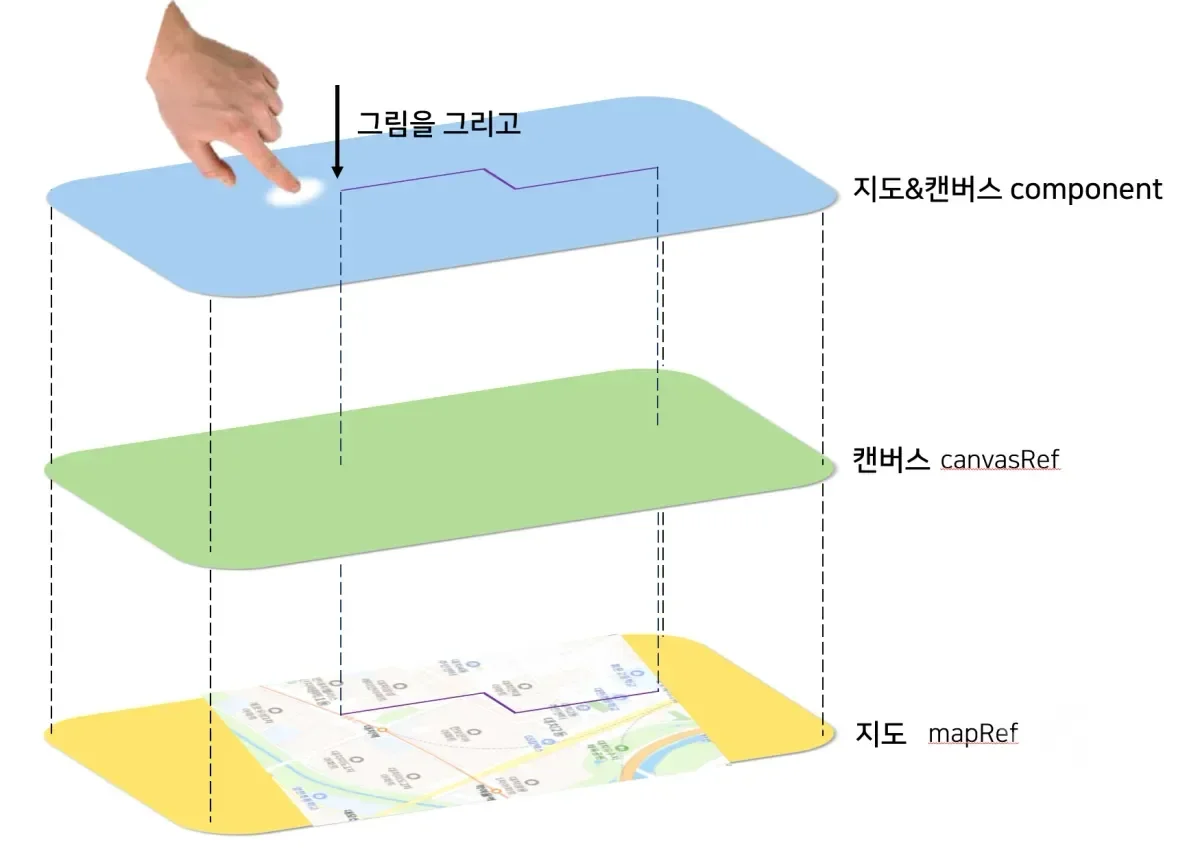
The structure designed after much deliberation is as above.
Establish the elements where canvas and map are linked as one component.
Users (other developers) don't need to know how the canvas and map are linked.
They just need to be able to use the functionality of drawing on canvas, moving, and zoom in/out linked with the map.
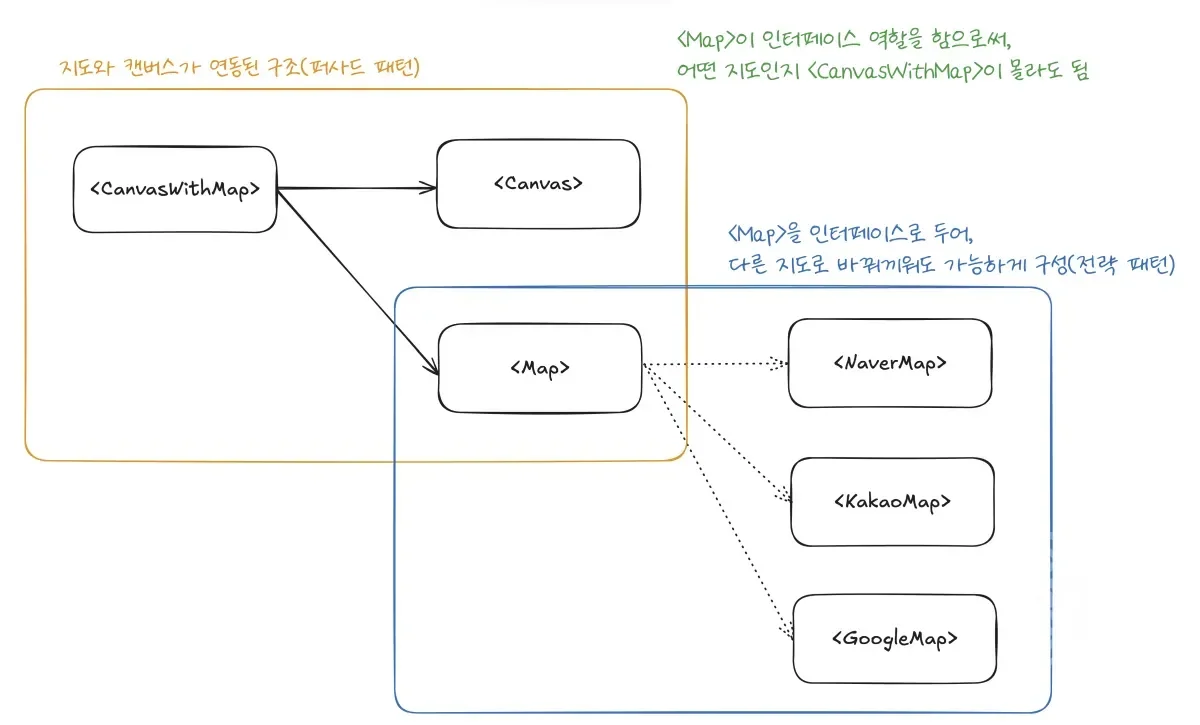
So, we bundled the canvas and map together as a component called <CanvasWithMap> using the Facade Pattern, and necessary operations are provided from outside through props or events.
Also, the map only plays the role of background. No matter which map is swapped in, <CanvasWithMap> doesn't need to know, and it just needs to function with the same interface for the map.
Accordingly, we designed the map and other detailed elements to be swappable using the Strategy Pattern.
Through this, we were able to clarify each responsibility in the map and canvas integration process.
📝 Canvas and Map Coordinate Transformation Process Design
I had already primarily analyzed the map and canvas in Beginning the Full-Scale Design :: Content Analysis.
Coordinate transformation required additional analysis.
First, I considered Naver Map's coordinate transformation since we used Naver Map as the standard for immediate completion.
I researched the Naver Map API very deeply regarding this, and the content is as follows.
Through the above ideas, I was thinking, and ultimately, coordinate computation would be done every time on the canvas, but for the mapping process, we decided to use re-rendering.
I'll cover this again later.
📝 Component z-index Design
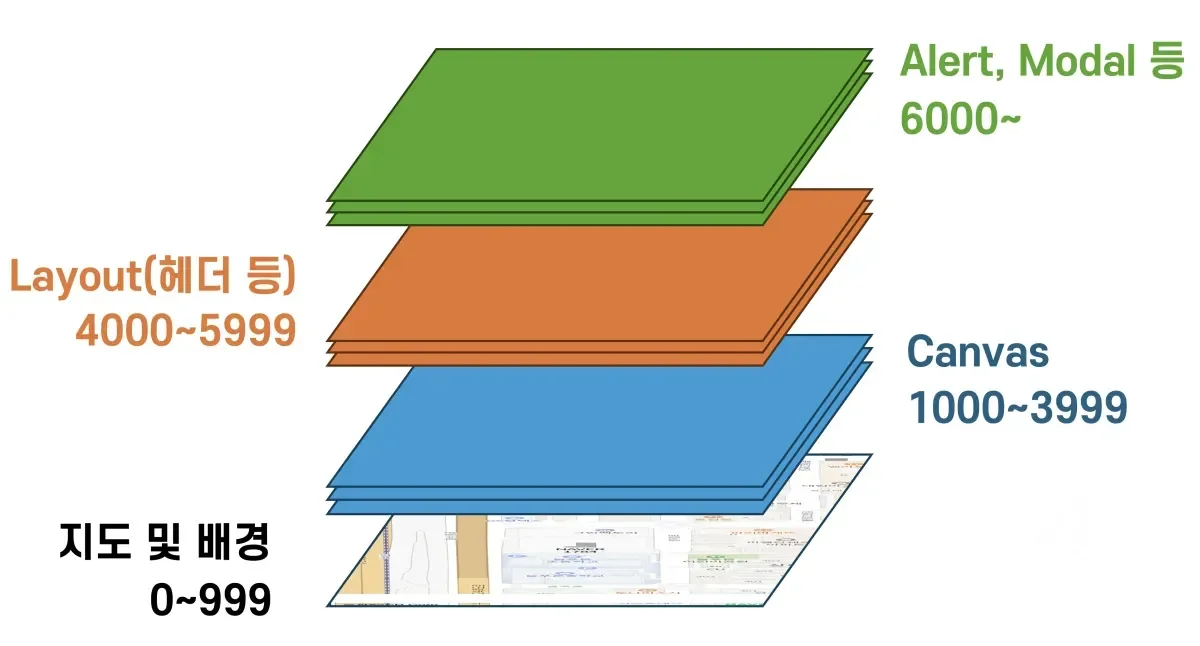
As explained initially, canvas and map are composed of separate layers, and each layer overlaps through z-index.
I proceeded to set how to configure z-index in more detail regarding this.
📝 Designing the Flow from Loading to Operation
In the process of designing, while continuously seeking implementation methods, I realized that we need to consider not just integration but also loading, etc.
The Naver Map object is received asynchronously, but handling it needs to be shown immediately after loading, so such order also needed consideration.
So while implementing through the direct examples mentioned earlier and understanding how each element would work, I was also able to supplement the lacking points through mentoring with the mentor and do the following design.
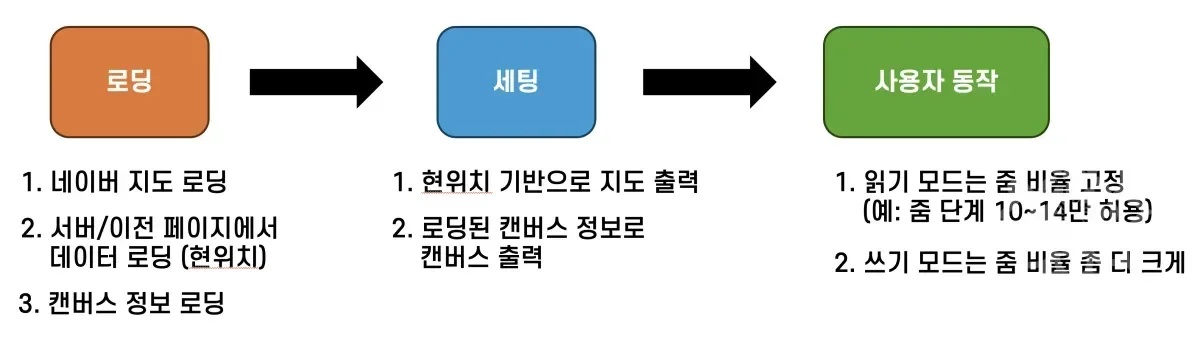
In the loading stage, the flow of data processing needed to be considered, so even if it proceeds asynchronously, it was composed to have a sequential flow. (async, await)
For setting, output the map based on loaded data, then output the canvas.
In this process, if loading takes long, output a loading screen.
For user actions, operate differently according to permissions, and this will be considered later.
📝 How to Synchronize Map and Canvas Position When Events Occur
In the case of Naver Map, I understood that loading is required for sudden position changes or zoom in/out.
It downloads only the necessary parts in advance, and gets the next area immediately according to user interaction.
I tested and understood the operation as above.
And based on this, I thought that if we get the vertex coordinates when loading progresses and synchronize the map and canvas at this time, we could improve user usability and respond even if there are subtle synchronization issues between map and canvas.
Just in case, I also confirmed when moving slowly, and discovered that the exact same logic was applied.
Based on this thinking, rather than detecting events and computing constantly, the process of re-computing at the loading time seemed like a good option too. However, for this part, I wanted to proceed with a more suitable method while actually implementing.
With the core being coordinate calculation based on vertex latitude and longitude, I considered the following sequence.
- Zoom in/out event occurs or movement event occurs
- Map changes based on when the event ends
- Get vertex coordinates from the map
- Re-compute canvas based on received coordinates
- Output to screen
I decided to synchronize the screen and canvas when events occur in the above sequence.
📝 Design for Implementation Order
Finally, I decided on the implementation order and entered implementation. The order considered at that time was as follows.
- Output map and canvas as stacked layers
- Output map with a specific position (current position or arbitrary position) as center
- Implement logic to get Naver Map's vertex coordinates
- Implement logic to map canvas vertices and Naver Map vertices' latitude and longitude
- Implement function to compute so points can be displayed on canvas based on latitude and longitude
- Implement logic to output coordinates on screen based on computed values
- Implement logic to recalculate from step 4 when events occur
🧑💻 Z-index Setup
The first thing I did after design was z-index setup.
This is tailwind.config.js, and for now, I made it possible to quickly set Z-index in hardcode format for feature testing.
🧑💻 Showing Canvas and Map Overlapped
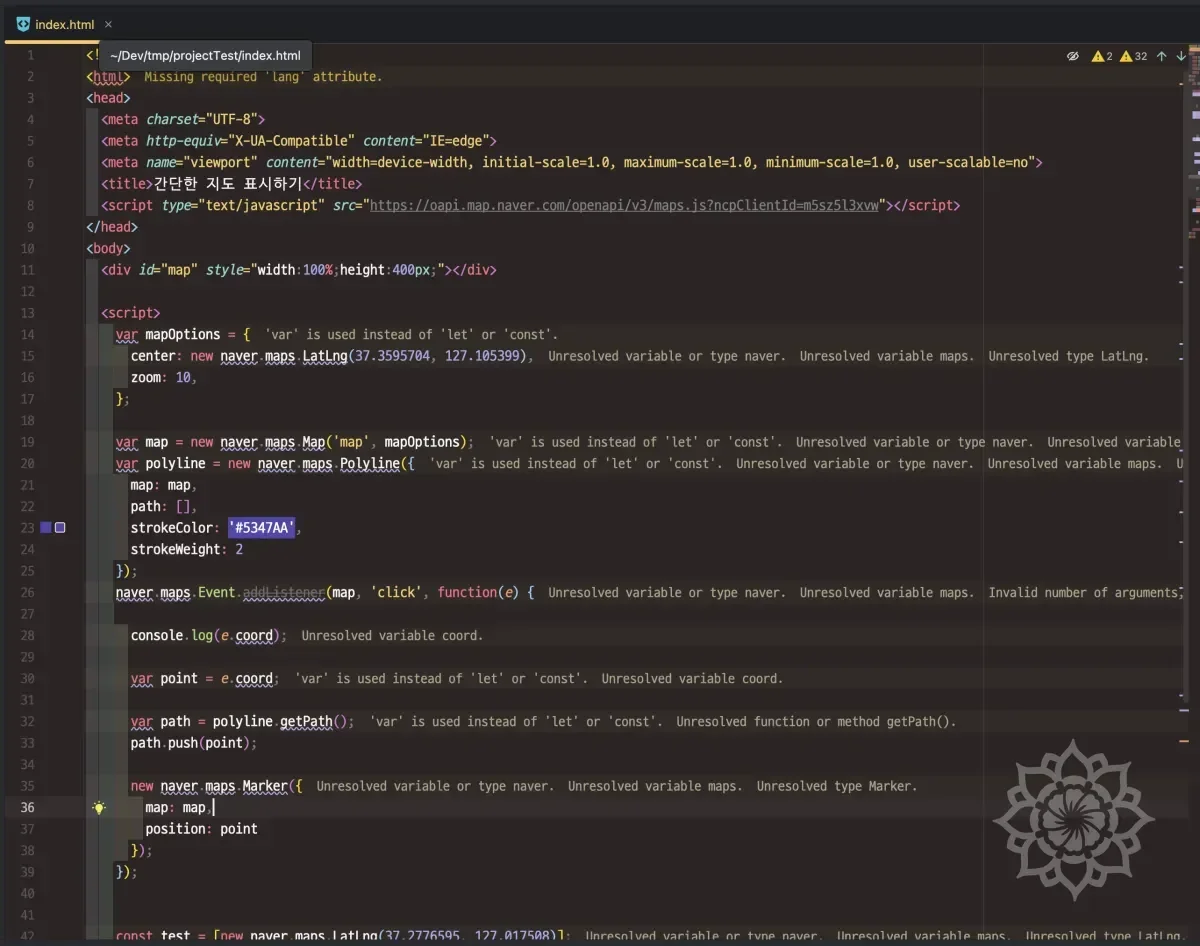
The next thing I did was implementing the map. Below is the map code.
And I implemented the canvas that becomes the base of the layer.
I intentionally placed a rectangle on the canvas. Through this, I wanted to confirm if the canvas was displayed properly. I made the canvas background color transparent and filled the screen so it could appear overlapped with the map.
And as above, I implemented the canvas and wrapped it with the map in a container called CanvasWithMap so it could be displayed together.
🧑💻 Technical Difficulty: How to Trigger Events on Overlapped Layers?
The process of overlapping the map and canvas went smoothly as mentioned earlier.
However, a big difficulty came from an unexpected place.
There was difficulty in how to trigger the same event simultaneously on overlapped layers like top-child and bottom-child above.
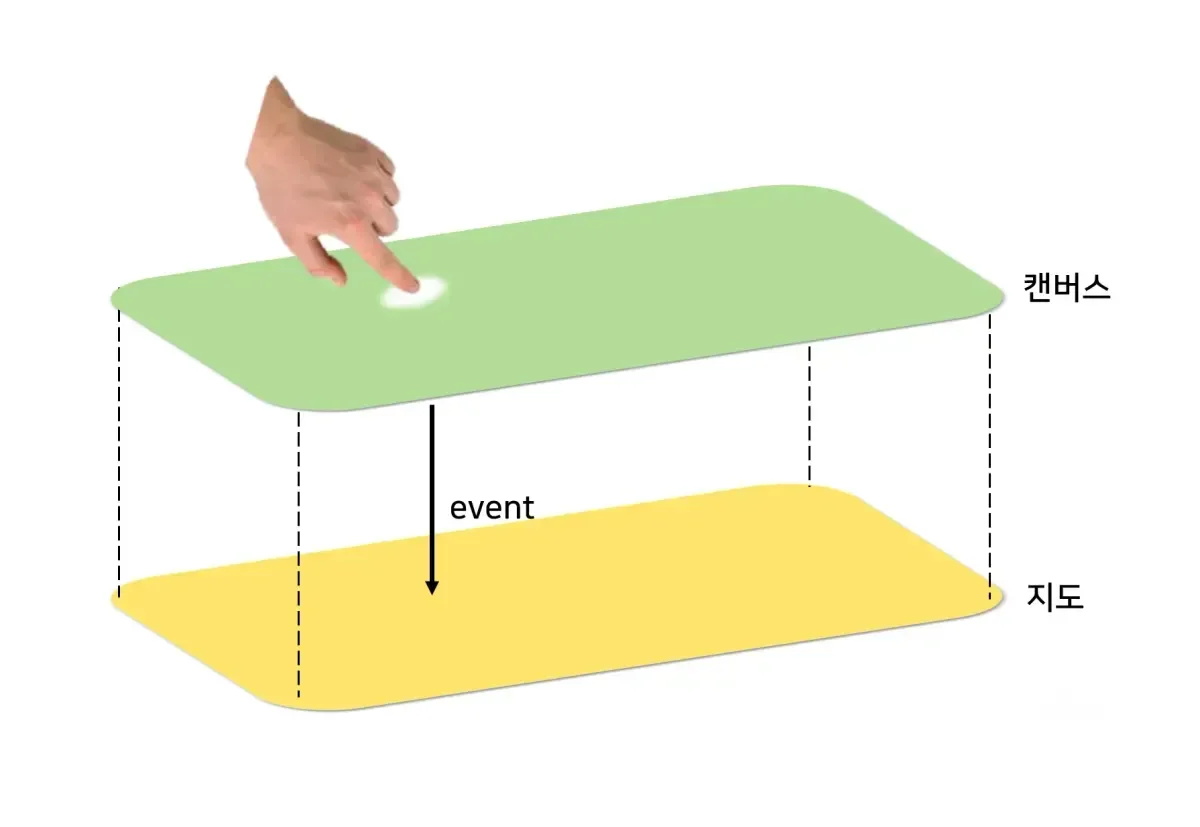
In our service, the map needed to operate as above.
When the map and canvas are overlapped, events needed to occur on both the map and canvas.
And the events we needed to handle were as follows.
- Click
- Drag
- Zoom in/out
These were the three events.
Actually, at first, I thought it was very simple without much thought.
Because I naturally thought that if you click top-child, the event would also be applied to bottom-child, the layer right below.
However, this didn't work as intended. Events were applied normally to top-child, but not applied to bottom-child.
🤔 Cause Analysis: Stacking Context
The cause was a problem due to Stacking Context.
Refer to the above article I wrote before regarding stacking context itself.
There exists something called Stacking Context where CSS elements are displayed on screen. When you set z-index, elements with higher z-index values are positioned in front of elements with lower values.
And the browser processes events from the topmost element when a click event occurs.
Since top-child is on top, it delivers the event there first. And it was a problem caused by top-child intercepting and resolving this event, then blocking event propagation with something like stopPropagation.
Actually, when we implement headers with absolute, events only apply there and don't apply elsewhere.. I had overlooked this.
🧑💻 1st Attempt: Turn Off pointer-event Property
The first attempt was to turn off the pointer-event property of the element on top, top-child.
pointer-events - CSS: Cascading Style Sheets | MDN
pointer-event is one of CSS properties that controls whether an element can receive pointer events like mouse clicks, touches, and cursor movement.
Simply thinking, if the topmost element is eating all the events, wouldn't it work if we just turn it off?
Since we were using tailwindcss, we could turn it off just by adding the pointer-event-none class as follows.
This way, you can turn off all pointer events for top-child.
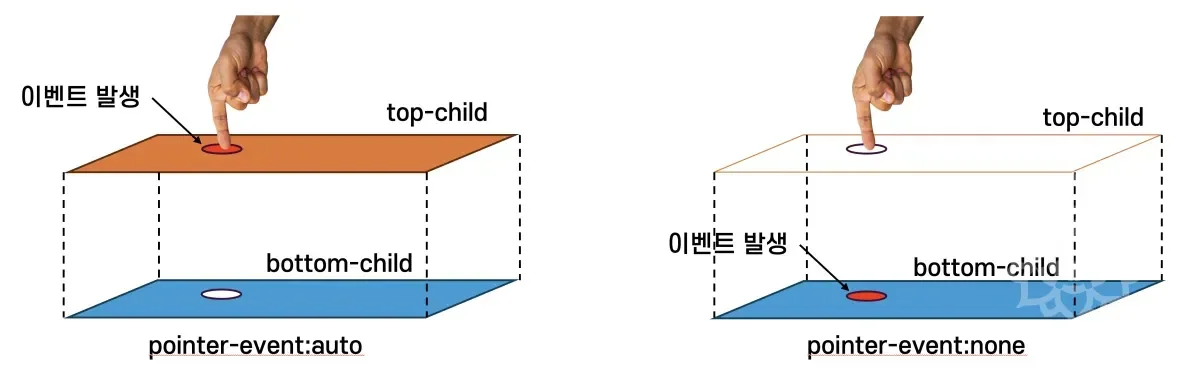
When you set pointer-event-none, top-child no longer receives events, and bottom-child receives events.
However, this wasn't what we wanted. Because we wanted the same event to occur simultaneously on both top-child and bottom-child.
🧑💻 2nd Attempt: Triggering Events Directly on Child Elements
The second attempt was to trigger events on top-child and bottom-child when an event occurs on container.
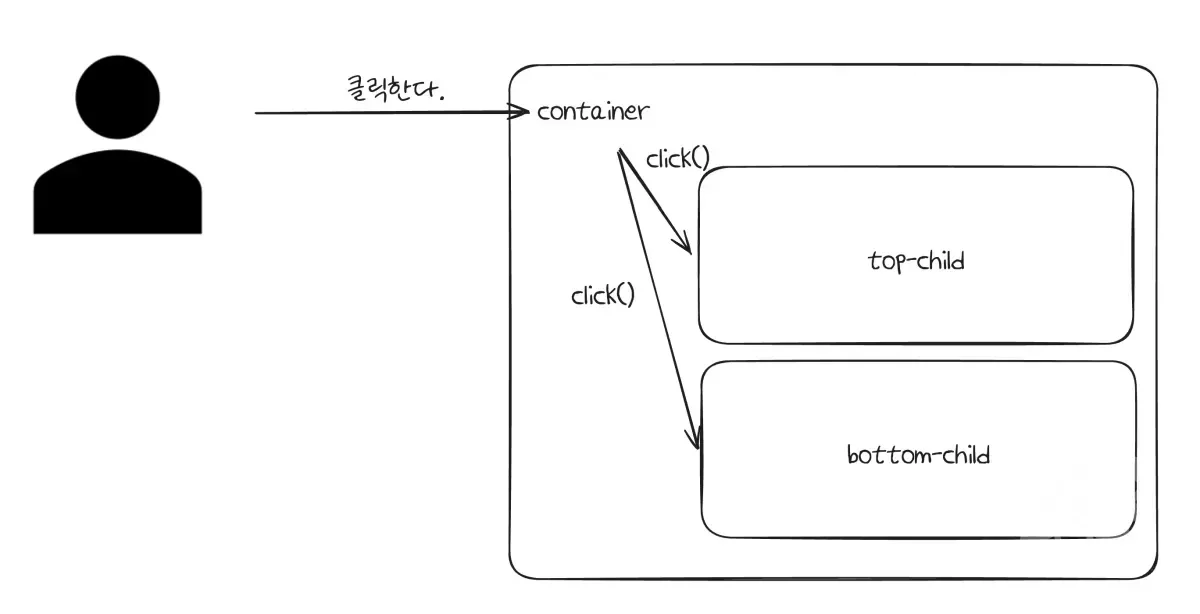
Thinking based only on click, it was a method to trigger events on top-child and bottom-child when a click event occurs on container.
I implemented the code as follows for this.
This way, when a click event occurs on container, you can trigger click events on top-child and bottom-child.
However, this had 2 problems.
- The method through
refcan only trigger basic events ofHTMLElement. - When triggering events like
click(), you can trigger the event, but you cannot pass additional information like where the mouse was clicked.
UI events are defined as above, and the event object contains additional information about where the mouse was clicked, which button was clicked, etc.
However, looking at the official documentation, there aren't many supported Triggers.
We needed to think about integration with Naver Map and various maps, so we needed to generate and pass more diverse events.
Not simply just responding to various maps, but even looking at specific maps like Naver Map alone, they were creating and providing custom events.
Also, when triggering events through methods like click(), since it doesn't create an event object, you cannot pass additional information about the event object.
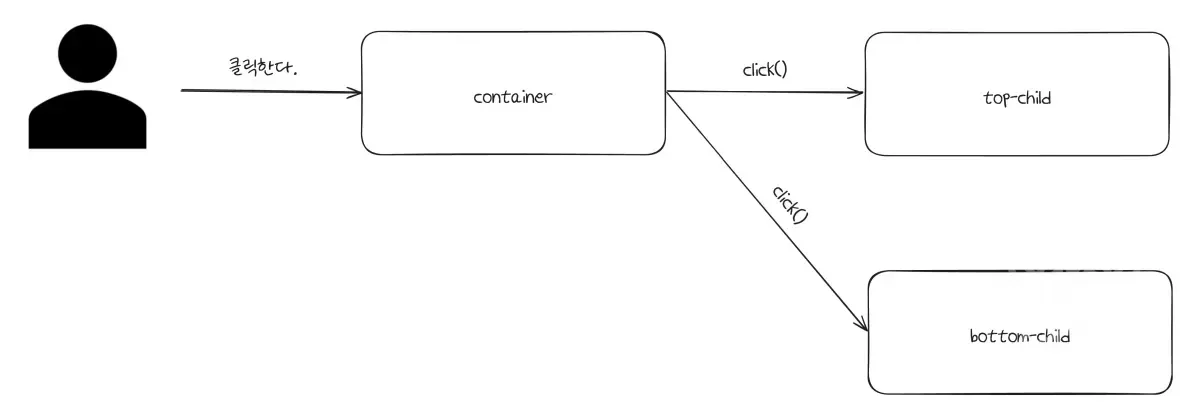
As you can see from the diagram above, this method allows triggering events not only when overlapped but also on elements far apart.
Also, ref.click() doesn't receive arguments.
This means you cannot pass the event object, which also means you cannot pass information at the time of event occurrence.
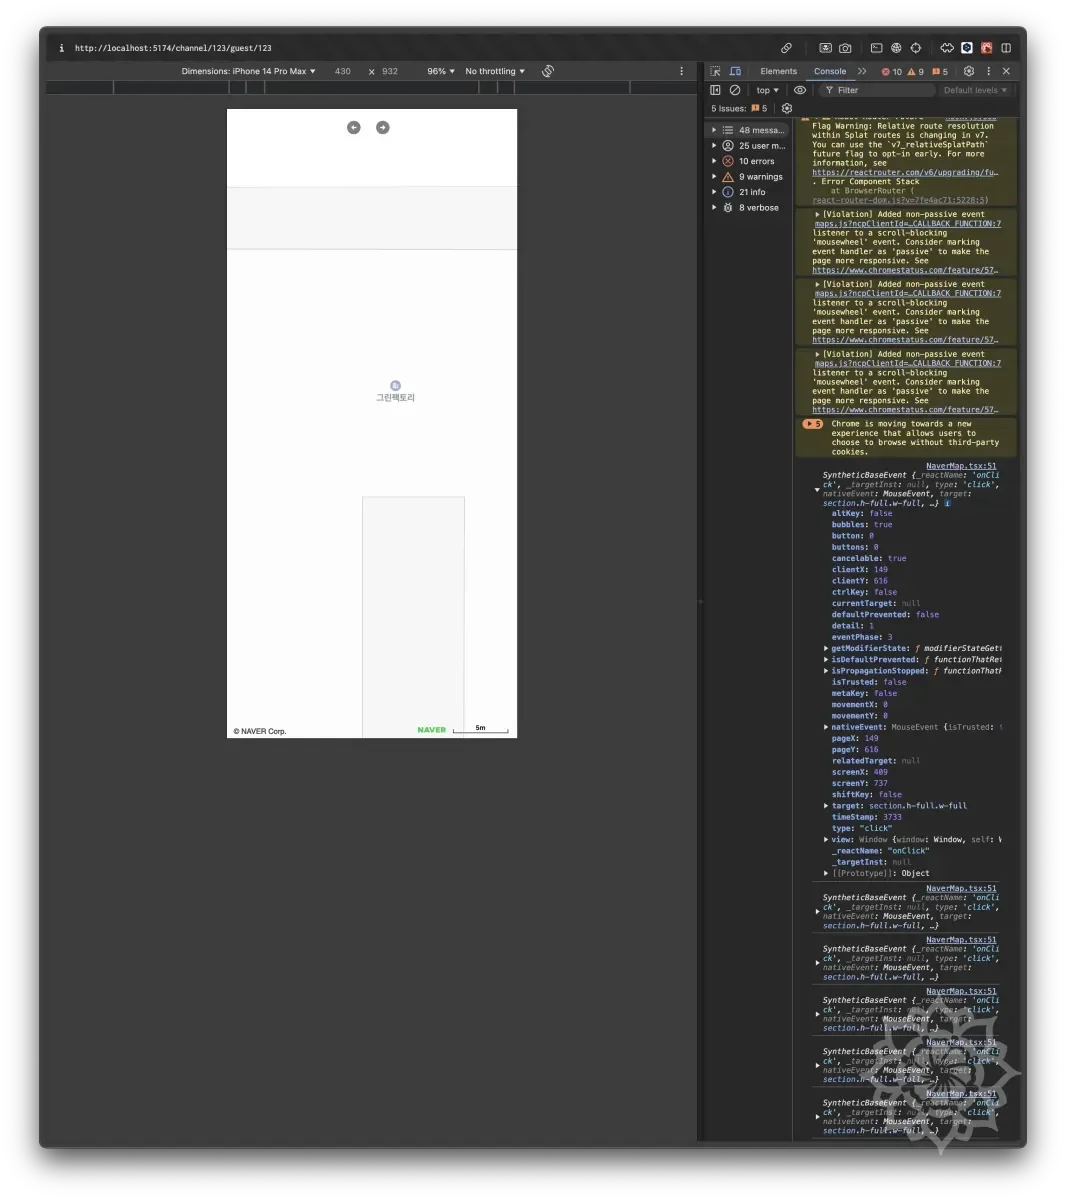
Actually, if you output this, it comes out as follows.
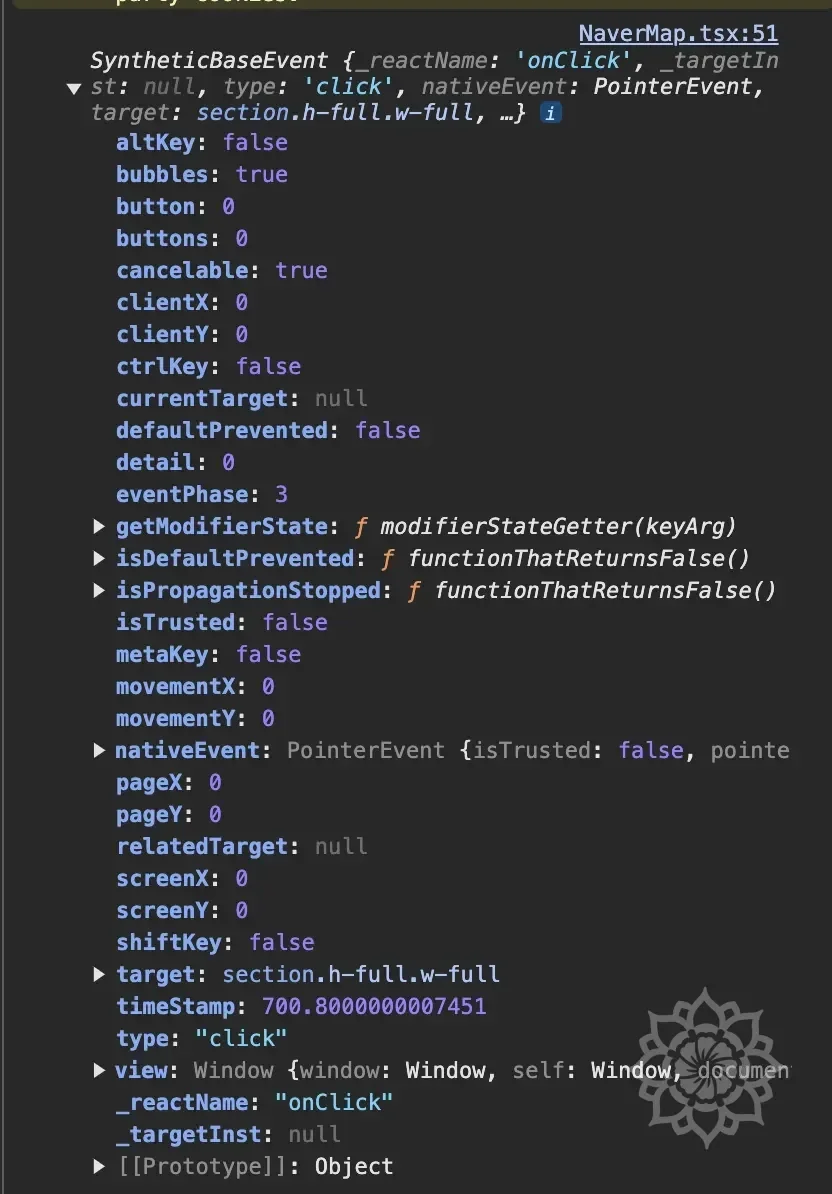
Looking above, you can see that various information like clickX, clickY are all filled with 0.

As seen above, you can see that the arguments are 0.
🧑💻 3rd Attempt (Success): Event Delivery Through Custom Event
During the BoostCamp process, I had learned about EventEmitter.
I had learned how to handle multi-threading in the Node.js environment, and during this process, I used EventEmitter.
At that time, I had learned how to trigger custom events, so it suddenly came to mind and I decided to apply it.
The method is simple.
Create an event object like new Event('click'), and catch it with dispatchEvent().
The structure for this is as follows.
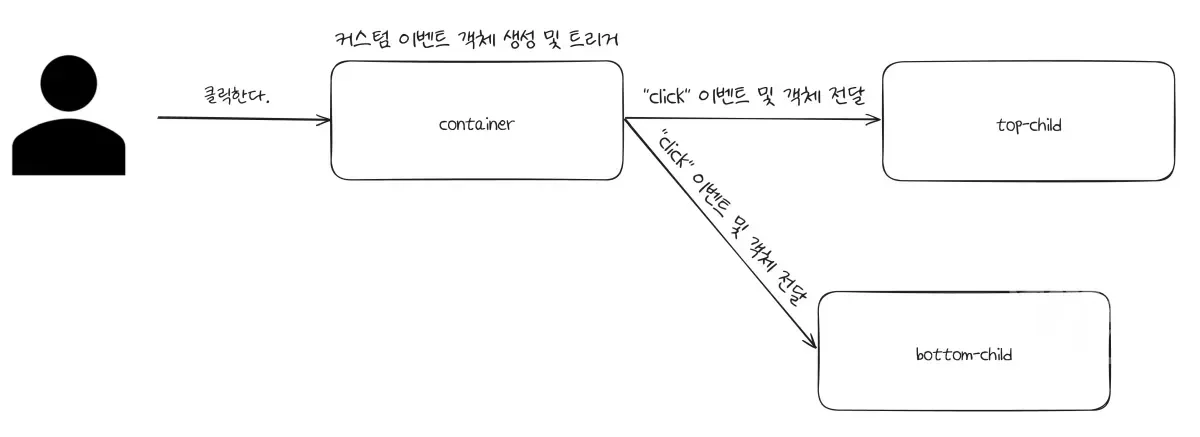
There's no big difference from what was drawn before, but the method is to define a custom event and deliver based on it rather than directly triggering the event.
The advantages of doing it this way are as follows.
- If you create and deliver a basic event like
"click", you can cause the same effect asclick(). That is, using basic events is possible. - You can use custom events created by Naver Map or various maps as they are.
The principle for this is as follows.
Since it uses the HTML standard method, ref was needed to use this.
Since I already used ref above, I decided to utilize it.
The code for this is as follows.
This way, you can create events through MouseEvent and trigger events through dispatchEvent.
This is the actual code I wrote, and it's a format where you create an event object and receive it with dispatchEvent.
For reference, looking into it, the differences between ref.current.click() and dispatchEvent were as follows.
| Property | ref.current.click() | dispatchEvent() Method |
|---|---|---|
| Event Propagation | None (No bubbling) | Bubbling possible (bubbles: true) |
| React SyntheticEvent Behavior | No | Works |
| Execute Default Click Action | Executed (like clicking <a> link) | Not executed |
| Use Purpose | Simple DOM click trigger | Customized event handling |
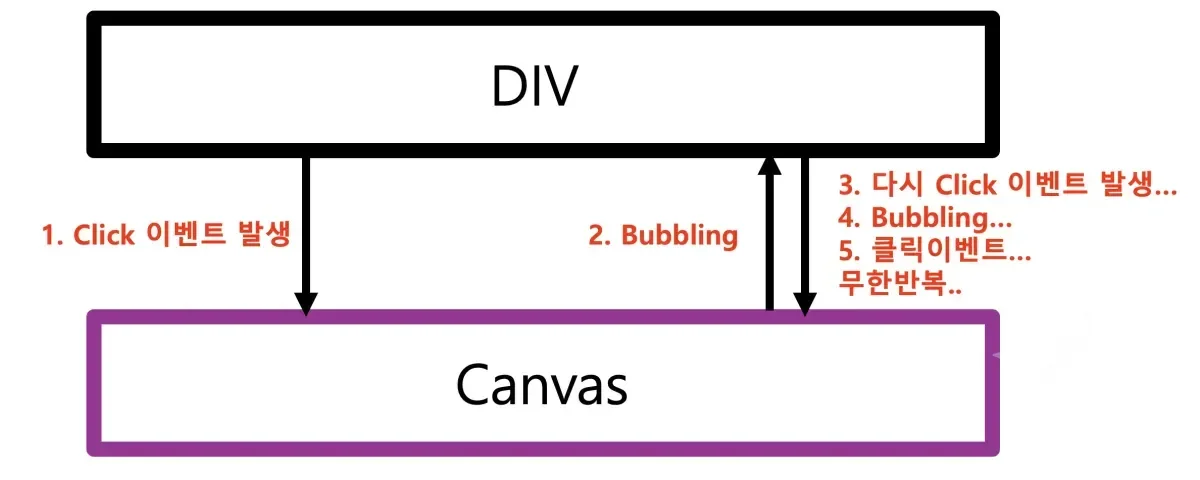
🤔 Call Stack Error Occurred
I thought it would work well, but the following error occurred.
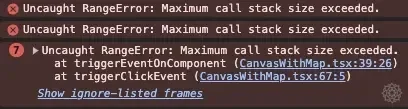
Interpreting the error message, it was an issue where the call stack overflowed... (Using Mac and browsers are optimized for this too, so it was fresh since I hadn't seen this issue in a very long time.)
The code logic clearly had no problems, so why...? Looking into it, the following setting was made.
Related to event capturing/bubbling, the bubbles property was set to true, and this was the problem.
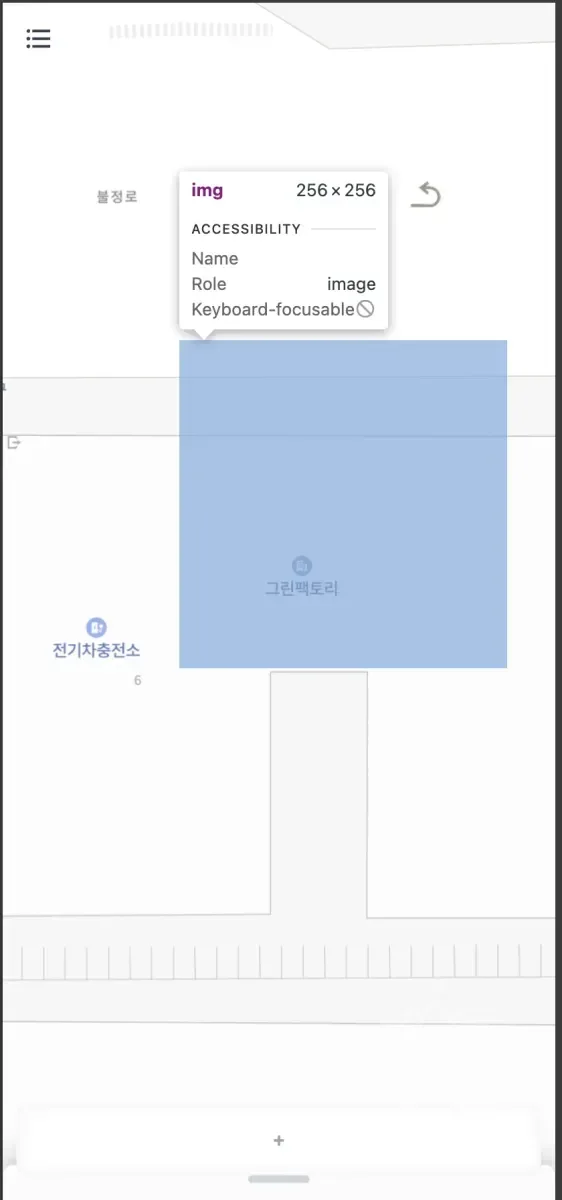
After doing all this, I was able to trigger events simultaneously as originally intended, and coordinate delivery was also possible.
As above, you can see that events are working normally.
Now I was able to trigger events as intended.
🧑💻 Additional Consideration: Naver Map Handles Events Internally.
Like this example, I was thinking in terms of HTMLElement units.
Although I said I considered Naver Map and various things earlier, I hadn't actually overlaid something on the map and tested its operation.
As you can see from the above link, Naver Map provided its own functionality for movement.
As mentioned earlier, when looking at Naver Map through developer tools, Naver Map is implemented in a way that combines multiple images in tile units to show a single screen, so I thought they might have implemented it this way to handle this simultaneously.

Looking at the options clicked, I could see properties like absolute and z-index, and I thought it might operate on a single layer.
Also, since Naver Map loads only necessary parts rather than loading all maps as confirmed earlier... I thought they might have implemented all event handlers internally for handling such parts.
As seen from the above example, it seemed like elements like panTo, panBy could be used for movement and such.
🧑💻 Last Problem: What to Do About the Subtle Synchronization Difference Between Canvas and Map?
Through the 3rd attempt and additional considerations, I was now able to implement the integration between Naver Map and canvas.
However, as above, I could see that the map and canvas movement weren't properly synchronized.
Even if moving with matched values, as in the video above, since the map re-renders every time, there was inevitably going to be a difference.
I was at a loss for a moment... but fortunately, I remembered that the canvas also re-renders every time when moving, so accordingly, I adopted a method where both the map and canvas re-render simultaneously when moving beyond a certain level.
For dragging, events occurred too frequently, so throttling or debouncing needed to be applied.
Accordingly, the final code written is as follows.
🚀 Wrapping Up
It seems like this was a really long article.
When I first decided to write, I didn't think it would get this long... and it doesn't seem well organized either...
I'll need to continuously refine it.
In this article, we looked at how to integrate canvas and map from the perspective of events.
This is the actual process of working on the project, and although I wrote briefly, it seems like it took a really long time to debug and track each process.
Through this experience, I was able to increase my understanding of events themselves, and through this, I think I'll be able to solve other events faster.
To add a little aside... I struggled a lot and explored a lot to the point where I feel like I can handle any event situation given to me.
I intentionally wrote in detail about what I experienced... hoping that if there are people who have experienced similar problems, they can be helped through even a part of this article.
📚 Summary
- Methods that trigger through
click()and similar cannot pass the event object. - Creating events through
MouseEventand triggering events withdispatchEventseems to be the most versatile method. - Triggering the same event simultaneously and producing the same visual effect is not a problem that can be solved with just one event. As I considered the synchronization difference as the last consideration, additional factors need to be considered according to the situation.
- In other words, there is no silver bullet. You need to find the appropriate solution for the problem.
- I hope this article helps when exploring such problems.
Thank you for reading this long article. 🙇