
This post was written based on Chrome browser and React Developer Tools version 6.0.1.
Message I Want to Convey
- You can measure performance and proceed with optimization using developer tools.
- React Developer Tools are awesome. Let's use them for development.
Motivation for Writing
I used to debug using only console.log and analyze the process while developing.
Then, I learned about debugger and gradually started using Chrome Developer Tools, which made development easier.
While using React, I learned that developer tools exist for it.
As I became interested in optimization, I thought I could make better use of these tools.
What Are Developer Tools?
Developer tools (or "dev tools" or "DevTools" for short) are programs that allow developers to create, test, and debug software.
> MDN - Developer Tools
In development, "tools" usually refer to software that helps developers with their work.
They provide many features to efficiently understand program behavior and perform debugging. (For example, pausing code execution to check variable values, measuring code execution time, etc.)
React Developer Tools
This is a browser extension released in 2015 to help with the convenience of React development.
React Official Documentation - New React Developer Tools
React Official Documentation - Developer Tools Installation Guide
You can easily download it from the sites above.
React Developer Tools Settings

If you enable the "General -> Highlight updates when components render" option, components will be highlighted every time they render, allowing you to see when rendering occurs.

If you interact with the app while the developer tools are open, you can see components being highlighted every time they render.
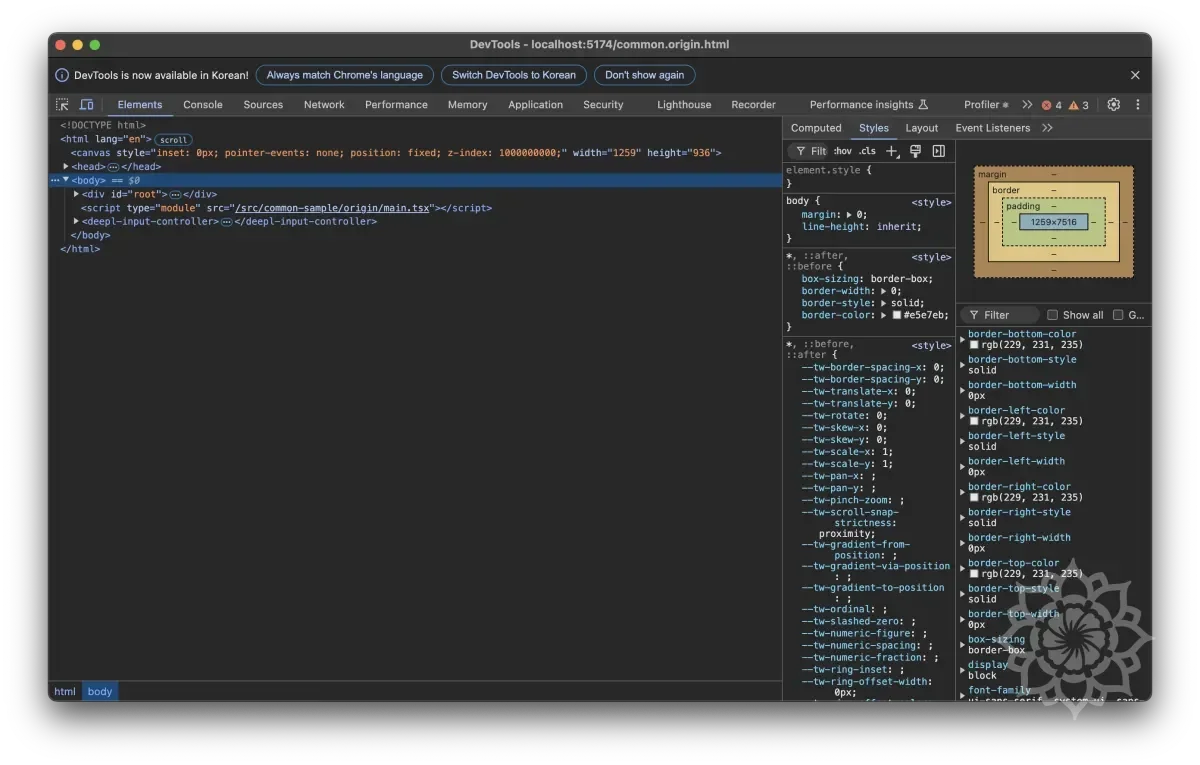
Components Tab
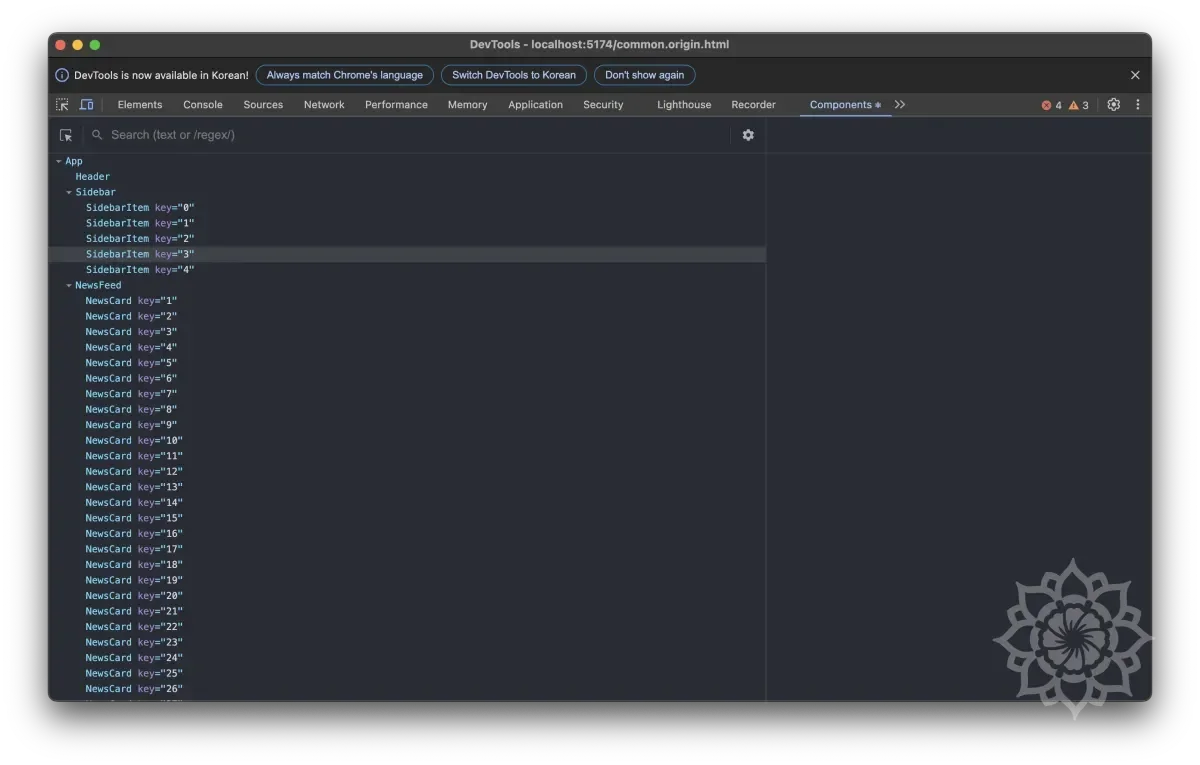
In the Components tab, you can check the following features:
- You can view the component hierarchy.
- You can view the component state.
- You can view the component props.
In other words, it helps you move beyond console.log for React development.

By changing property values on the right side, you can see how components render when state changes.
It also provides convenience for tracking source code.
Logging Feature

In addition to simply manipulating components state, it also provides a feature that can replace console.log.
The logging feature is just that, and you can use logging through the bug icon in the upper right.
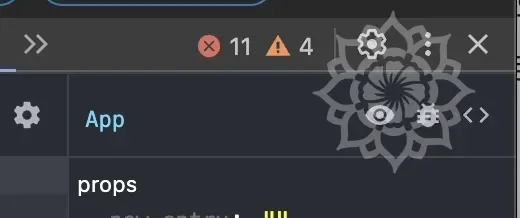
By clicking the bug icon in the center, you can output all component-related information to the console, including props, hooks, nodes in the DOM, and file location in the system.
Component Filtering

"Components" -> "Hide Components where ..." -> "Add filter"
In the React Developer Tools settings, you can hide specific components through filtering.
By setting options in the Components tab, you can find and view only what you want in complex components.
Profiler Tab
The most important thing in optimization is performance measurement.
Using the Profiler tab, you can measure performance and observe how rendering occurs.
How to Profile
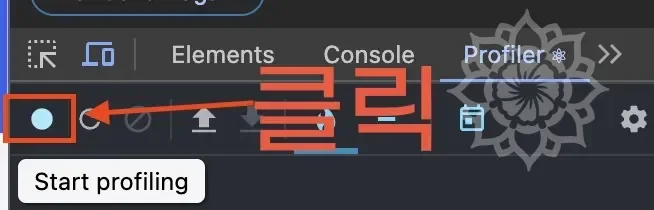
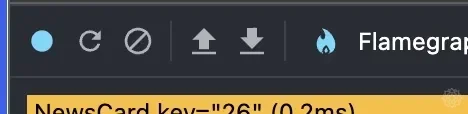
In the profiling tab, you cannot see any content until you press "🔵" to start recording.
When you press the blue button to start recording, performance information is automatically collected every time rendering occurs.
During recording, just use the app as you normally would, and click the "🔴" button to stop collecting.

Commit Chart
To understand the commit chart, you need to understand React's rendering process.
The commit chart is a chart that records the Commit stage in the React rendering process.
Commits are displayed as a bar chart in the upper right of the profiler.
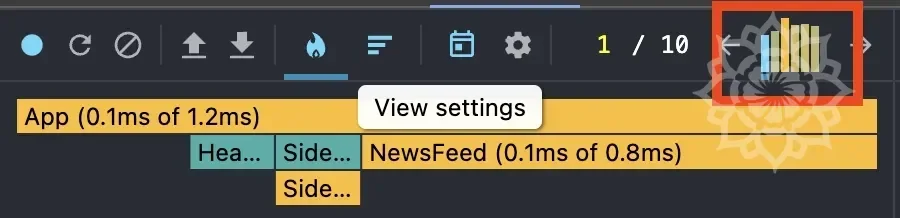
The part shown in red is the commit chart.
Each bar shows performance information grouped by commit.
You can compare rendering time through the color and height of the bars.
A long yellow bar (🟨) means it took longer than a short green bar (🟩).
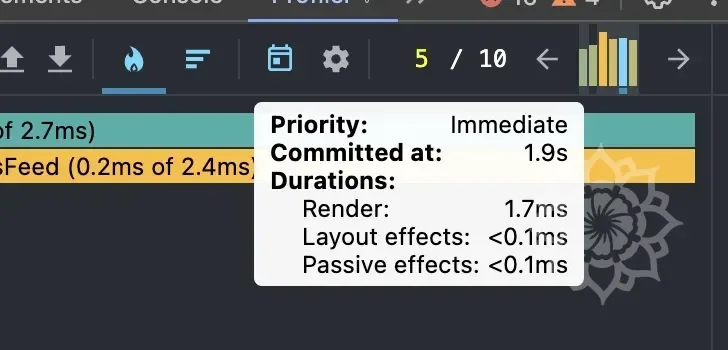
You can click on each bar with the mouse or click the left/right arrow buttons to view detailed information for each commit.
The selected commit is displayed as a blue (🟦) bar.
Profile Filtering
The longer the profiling time, the more commits there can be.
This can make it difficult to find the information you want.
For this, the profiler provides a filtering feature.

You can find it in "Setting" -> "Profiler".
As you can see above, when you hide commits below a certain ms, you can see the bars decrease.
Flame Chart
Generally, a Flame chart refers to a tool for visually analyzing application performance.
It mainly helps you understand the function call stack and the execution time of each function at a glance.
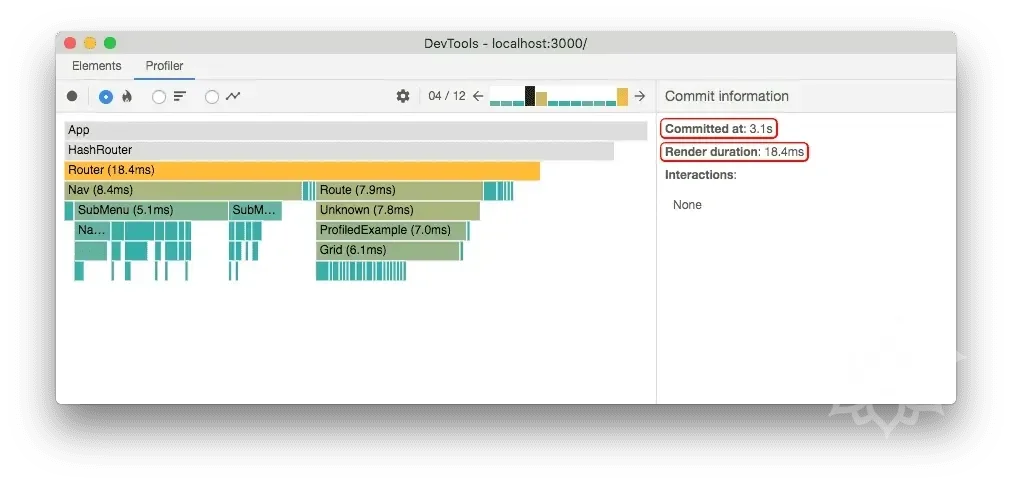
The flame chart in the React Developer Tools profiler shows the application state for a specific commit.
The characteristics can be summarized as follows:
- Rendering performance analysis: You can visually check how much time is spent when a component renders.
- Identifying re-render causes: You can identify parts where unnecessary re-renders occur and optimize them.
- Understanding component tree: You can see the call relationships between components at a glance and find structural improvements.
Each bar in the chart represents a React component.
The size and color of the bar represent the time taken to render the component and all its children.
The width shows the time taken when the component was finally rendered, and the color shows the time taken as part of the current commit.
The wider the bar, the longer the rendering took.
If the bar is yellow (🟨), it took a relatively long time, and if it's green (🟩), it took a short time.
If it's gray (⬜️), it means the component was not rendered at all during this commit.
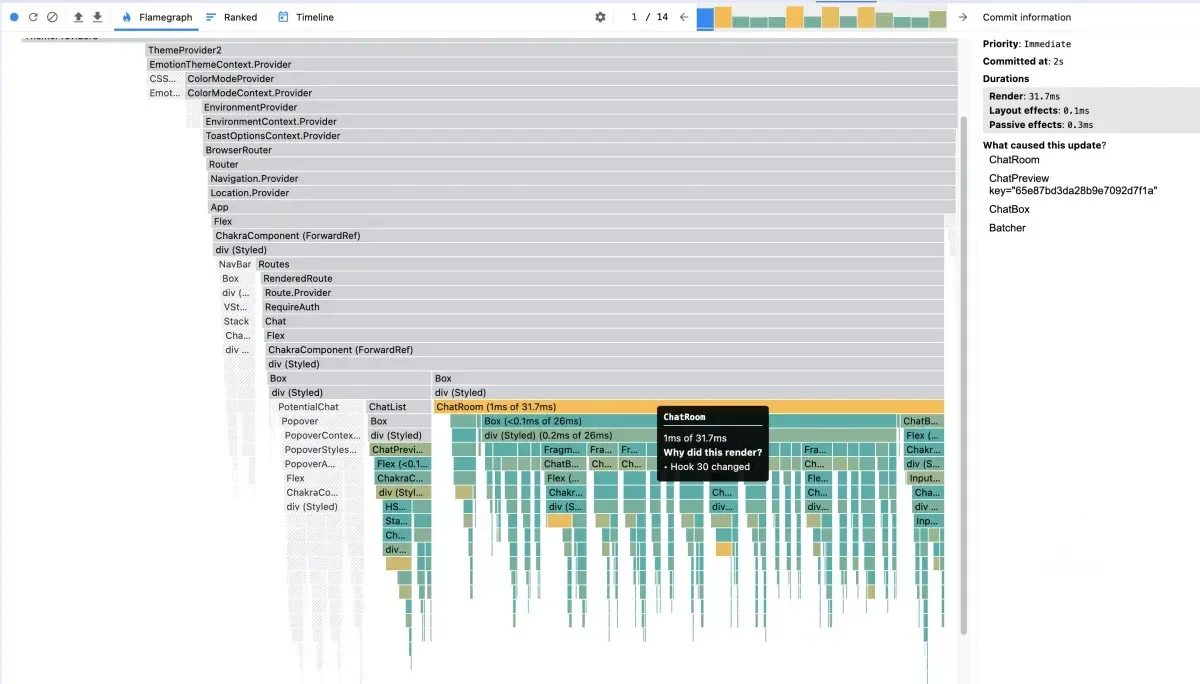
If you want to know how many times a specific component was updated, click on the bar with that component name in the flame chart.
You can check the clicked information in the Rendered at area of the right panel.
Ranked Chart
For individual commits, it shows components in order of rendering time, from longest to shortest.
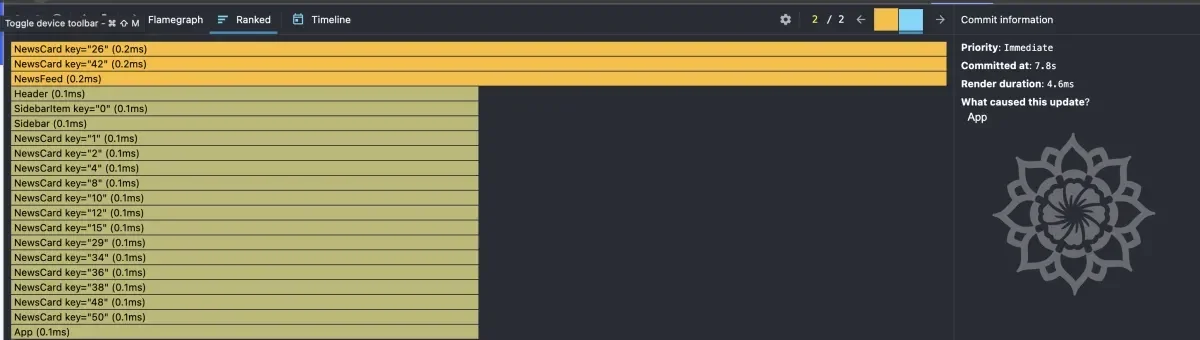
Each bar represents a React component.
The rendering time means the time taken to render that component and all its child components.
Therefore, generally, higher-level components are more likely to be at the top of the tree.
Like the flame chart, you can click on individual bars to track the number of times rendered and the cause of rendering.
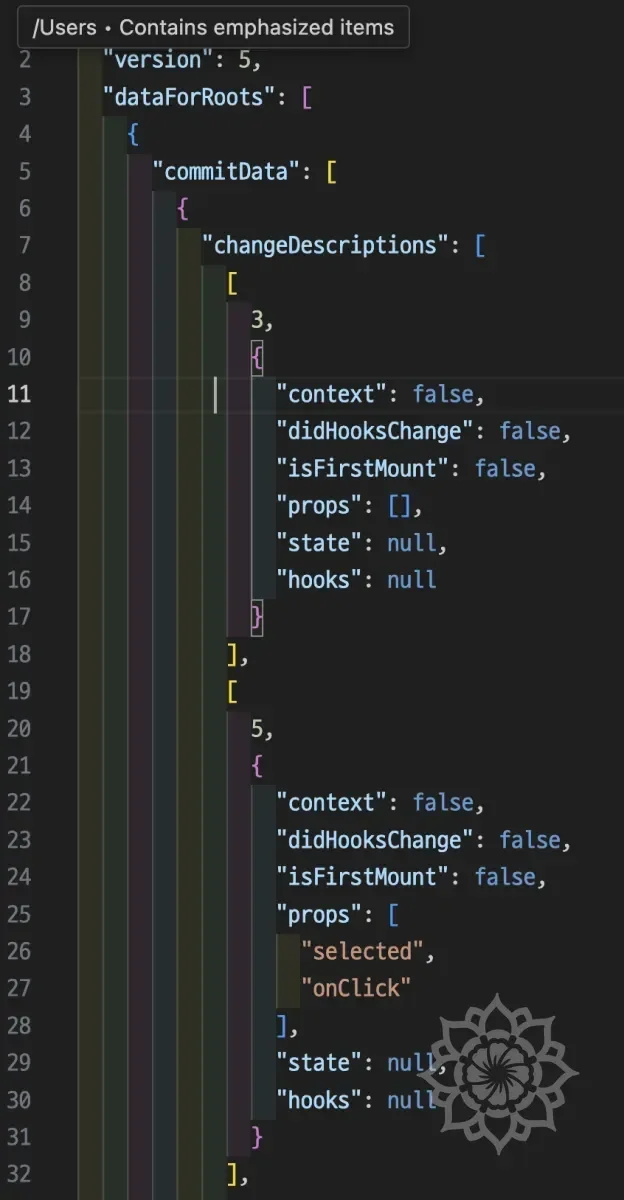
Save/Load Feature
A save/load feature is provided for sharing performance data.
Data is saved in JSON format, and you can simply view the data by loading it.
Conclusion
After organizing this once, I realized that console.log is a more inefficient method than I thought.
I plan to use React Developer Tools to proceed with optimization work more efficiently in the future.
References
React 개발자 도구 활용하기 (Dev Tools) - 시소
React Official Documentation - Introducing the React Profiler
React Official Documentation - Render and Commit